
Bay Area
What Oakland’s Homeless Audit Says About Evictions, Policing, and Fire
Although the audit was vast in its analysis, this guide attempts to outline key points from the audit related only to evictions and hygiene services, police response and costs, and fire department response and costs.

On April 14, Oakland’s City Auditor Courtney Ruby released an audit of the city’s homeless encampment management interventions and activities for the fiscal years 2018-19 and 2019-2020. The 95-page report includes data and estimations about interventions, populations, costs, and availability of services related to homeless people and their communities.
Claiming that the city “lacked an effective strategy…and did not provide sufficient policy direction or adequate funding,” Ruby also included recommendations for better addressing homeless communities. Although the audit was vast in its analysis, this guide attempts to outline key points from the audit related only to evictions and hygiene services, police response and costs, and fire department response and costs.
Evictions and hygiene services
The audit’s data on evictions and hygiene services is limited to the 2018-19 fiscal year and the first eight months of the 2019-20 fiscal year, when the city suspended most homeless evictions and cleaning interventions due to the COVID-19 pandemic in March 2020. During this timeframe, the city evicted 181 homeless communities. Of these evictions, 123, or about two-thirds of the total, were classified as “re-closures,” which the report defined as occurring “when homeless individuals return to a previously closed [homeless community].” In the fiscal year 2018-19, about 60% of evictions were re-closures. From July 2019 through February 2020, this ratio increased, and about 77% of evictions were re-closures.
The audit reports 1,599 interventions classified as “hygiene and garbage services,” and defines such interventions as “providing portable toilets, hand-washing stations, regular garbage service, and/or traffic barriers.” For each of these services performed per homeless community, the audit counts one intervention. These interventions are lumped together and lack individual data, meaning that the audit did not report precise data on how often the city provided trash pick-up to homeless communities.
The audit reports that the city increased its hygiene and garbage interventions. From 2018-19, the city provided 797 such interventions, or about 66 per month. During the first eight months of 2019-2020, the city performed 802 such interventions, or about 100 per month. After March 2020, in response to COVID-19, the audit claims the city increased the number of homeless communities that receive hygiene interventions from 20 to 40, but the vast majority of homeless communities in Oakland still do not get hygiene and/or trash services with any regularity. The audit estimates that there are at least 140 homeless communities in Oakland but acknowledges “that this estimate may be conservative.”
Police response and costs
Data recorded in the audit shows police response to 911 calls in homeless communities was not timely. While over 99% of 911 calls were classified as “Priority 2,” which the audit claims “ideally should be responded to in 10 to 15 minutes,” data provided by OPD showed the median police response time to Priority 2 calls was two hours in 2018-19, while the mean response time was four hours. In 2019-20, response time slowed by about 50%, with the median response time being about three hours, while the mean response time was about six hours. Data OPD listed related to response time range show the department took over two days to respond to at least one 911 call in 2018-19 and over six days to respond to at least one other 911 call in 2019-20. Although OPD recorded 1,458 calls to homeless communities during the two years of the audit, the audit only analyzed 988 of these calls, claiming that “response data was incomplete” for 470 calls.
The audit records OPD using about $3.1 million in costs associated with homeless communities. But that $3.1 million does not include an accurate account of overtime pay. OPD only started recording overtime pay related to homeless communities in February 2020, just before the frequency of interventions, notably evictions, declined dramatically.
About $1.7 million, a slim majority of OPD’s recorded costs related to homeless communities, are recorded as labor costs that went to the three members of The Homeless Outreach Team. The Homeless Outreach Team consists of one sergeant and two officers who dedicate 100% of their time to homeless community work.
The Abandoned Auto Unit incurred over $800,000 in labor costs to provide support at moderate to large homeless community evictions. They were responsible for “traffic control and tagging and towing vehicles at [homeless communities] when necessary.” About $600,000 went to labor costs incurred by Patrol staff responding to 911 calls.
Fire Department response and costs
The audit reports that The Oakland Fire Department responded to 988 fires in homeless communities in 2018-19 and 2019-20, which is more than one a day. The data recorded shows that the OFD response times for such fires were timely, arriving in just over seven minutes and 50 seconds to over 90% of calls. Such responses were slightly faster than responses to non-homeless community related calls, which, in 90% of cases, OFD responded to in about eight minutes and 10 seconds. OFD has recorded no injuries to firefighters fighting fires at homeless communities. One homeless resident died in 2020 as a direct result of a fire. The audit did not record fire-related injuries to homeless people or their lost possessions.
OFD-related costs accounted for an estimated $1.8 million in funds related to homeless communities in 2018-19 and 2019-2020. About $676,000 went to “fire prevention labor,” which includes labor costs associated with fire hazard inspections, investigations related to fires, and removal of hazardous waste. Over $ million went to both labor and equipment costs related to “fire suppression.” Fire suppression costs include costs related to fighting fires and rescue activities. OFD costs related to homeless communities rose over 40% from 2018-19 to 2019-20 while total fires at homeless communities increased about 17% over these years.


Activism
At the event, 16 entities signed the EIP pledge, vowing to take steps to increase public contracting opportunities in their spheres for small and historically underutilized businesses. The pledge signees included Hub International, the Port of San Francisco, the San Francisco Public Utilities Commission, California High-Speed Rail Authority, the Port of Oakland, Robert Graham of Webcor Builders, Holder Construction, the Weitz Company, Sky Blue Builders, Hornblower, Swinerton, Luster National, Talson Solutions, Center for Community Wealth Building, and the Construction Contractors Alliance.
By Calvin Naito, Special to The Post
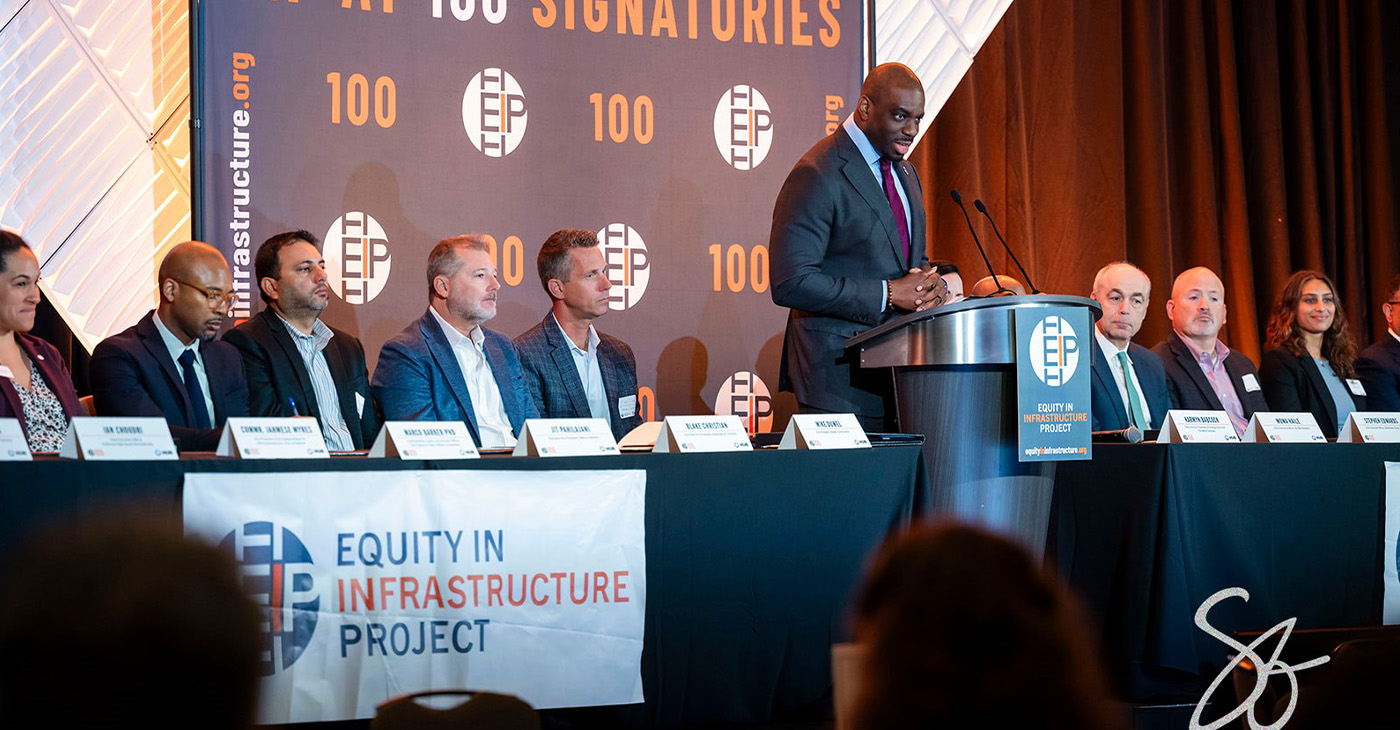
On June 4, a national nonprofit named the Equity in Infrastructure Project (EIP) – which aims to increase public construction contracting opportunities for small and historically underutilized businesses – held a day-long event in downtown San Francisco to rally supporters and build momentum to its cause.
It was attended by more than 100 individuals from public agencies, private firms, and other organizations committed to increasing contracting opportunities with governmental agencies, thereby creating more competition and lowering public costs.
The EIP event was held the Hyatt Regency San Francisco in conjunction with BuildIT, which aims to increase contracting opportunities for LGBT-owned businesses.
At the event, 16 entities signed the EIP pledge, vowing to take steps to increase public contracting opportunities in their spheres for small and historically underutilized businesses.
The pledge signees included Hub International, the Port of San Francisco, the San Francisco Public Utilities Commission, California High-Speed Rail Authority, the Port of Oakland, Robert Graham of Webcor Builders, Holder Construction, the Weitz Company, Sky Blue Builders, Hornblower, Swinerton, Luster National, Talson Solutions, Center for Community Wealth Building, and the Construction Contractors Alliance.
Following the workshop, BuildIT hosted a VIP evening reception honoring EIP, whose principals – Phil Washington, John Procari, and Rick Jacobs – accepted the award.
The event also set in motion the coalition’s efforts to implement recommendations from EIP’s “Procurement for Prosperity: A Playbook.”
The Playbook is a practical guide for public agency leaders and procurement and contracting practitioners to grow the capacity of small and first-time contractors, strengthen competition, and deliver better value for taxpayers.
Toks Omishakin, Secretary of the California State Transportation Agency (CalSTA), a long-time EIP supporter, also told attendees, “This is about commitment. This has been a life’s work. This is a tailwind moment.”
The event’s presenting sponsor was Hub International, one of the largest insurance brokerages in the nation, which was joined by partners Travelers Insurance and the State Compensation Insurance Fund.
After the pledge-signing ceremony, attendees participated in a workshop in which they examined the policies, practices, and programs needed to meet EIP goals, learned from practitioners, and identified next steps toward utilizing the Playbook.
Ingrid Meriwether, formerly of Merriwether & Williams Insurance Services (MWIS) and current president of Hub International’s Aligned Risk Management, MWIS, described the hard-fought lessons she and her MWIS team have learned over the last three decades administering contractor development programs (CDPs) for the City and County of San Francisco, Alameda County, City of Los Angeles, LA Metro, and other municipalities.
The CDPs help small and local construction firms win public infrastructure contracts with these government agencies. The program provides bonding assistance, contract financing, technical support, training, and other services to underrepresented businesses funded by public agencies who seek greater contracting participation with these firms.
Merriwether said programs like these “break down systemic barriers, create greater fairness, and save taxpayers money by enabling more competition. The contractor development programs have, cumulatively, over two decades, helped contractors access over $1 billion in bonding, supporting over $380 million in awarded contracts, and maintaining a loss ratio 250 times lower than the industry average – while saving participating municipalities more than $27 million in contracting costs as a result of enabling more competition.”
Rick Jacobs, EIP co-founder and co-chair urged attendees make plans to meet again in the near future “to continue building on this work, share progress on organizational commitments, and discuss how we can collectively advance the goals of the EIP pledge.”
For more information on the EIP and to access a copy of the Playbook, go online to https://equityininfrastructure.org/
Calvin Naito is communications manager for Equity in Infrastructure Project.
Activism
Oakland Museum Presents Landmark Retrospective Celebrating Beloved Bay Area Artist Mildred Howard
“Poetics of Memory” coincides with a year of major recognition for Howard. In 2026, she received the California Arts Council’s 50th Anniversary Award, honoring artists whose work has shaped California’s cultural and civic life, as well as the Museum of the African Diaspora’s Artist Impact Award. In 2025, she was awarded a prestigious Guggenheim Fellowship in recognition of her transformative contributions to American cultural life.
Special to The Post
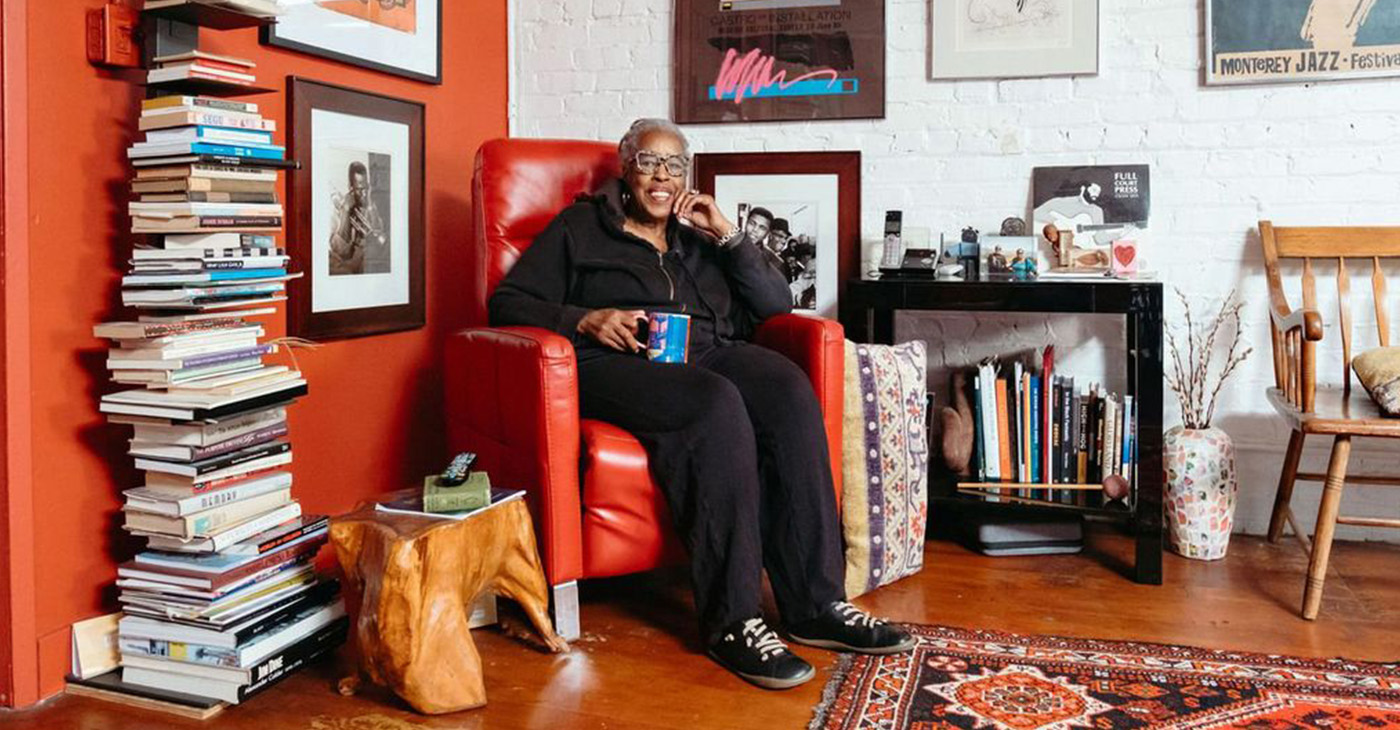
The Oakland Museum of California (OMCA) opened “Mildred Howard: Poetics of Memory,” the first major museum survey of Bay Area artist Mildred Howard, on June 12.
The exhibition spans five decades of Howard’s influential work, bringing together immersive installations, found-object sculptures, archival materials, and new commissions that explore memory, identity, and power in American life.
“Poetics of Memory” coincides with a year of major recognition for Howard. In 2026, she received the California Arts Council’s 50th Anniversary Award, honoring artists whose work has shaped California’s cultural and civic life, as well as the Museum of the African Diaspora’s Artist Impact Award. In 2025, she was awarded a prestigious Guggenheim Fellowship in recognition of her transformative contributions to American cultural life.
Howard was born in San Francisco in 1945 and raised in the East Bay, where she went on to study Afro-Haitian dance, make and sell clothing, and experiment with collage and sculpture.
Her multimedia art practice emerged from these experiences, later becoming associated with West Coast conceptual art, San Francisco funk, and a vibrant community of artists like Oliver Jackson, Betye Saar, and Raymond Saunders. Since the 1970s, she has used found materials and family stories to explore memory—both individual and collective.
At OMCA, visitors enter “Poetics of Memory” through a series of intimate galleries featuring Howard’s early mixed-media pieces and sculptures, along with a large video projection of a number of her public artworks.
Together, they emphasize Howard’s interest in everyday objects as powerful carriers of individual and shared stories. Highlights include collages that remix images of the artist herself; found-object sculptures like The History of the United States with a few Parts Missing (2007) that address omissions in dominant narratives; and public works like “Locks and Keys for Harry Bridges” (2001) that transform urban space into a meditation on access and labor.
This culminates in a richly detailed “studio” environment, where works in progress, archival exhibition flyers, historic photographs of Howard and her community, postcards from fellow artists, and other materials offer insight into her creative process and daily life.
The exhibition then opens into a high-ceilinged, dramatically lit space that brings together Howard’s signature immersive installations. On one end, “Crossings” (1997/2026) – a field of hundreds of ceramic eggs leading to an ornate mirror – suggests cycles of birth, motherhood, and transition, while drawing on the emotional echoes of the Middle Passage. On the other end, “Blackbird in a Red Sky” (a.k.a. “Fall of the Blood House”) (2002) – a red glass shack bordered by a pond – also uses reflection and transparency to draw viewers into the work and prompt consideration of themes of identity and home.
Howard’s newest video installation, “Moving Stills” (2026), repurposes never-before-seen family footage she took as a teenager on a train trip to the American South. Projected onto cascading layers of translucent fabric that stretch across an entire gallery wall, the piece immerses viewers in a layered meditation on memory, migration, and time.
The “Mildred Howard: Poetics of Memory” exhibit will be on display through Oct. 11 at the Oakland Museum of California, 1000 Oak St., Oakland, CA 94612. Museum hours are Wednesday through Sunday, 11 a.m. to 5 p.m., with extended hours on Fridays to 9 p.m.
This story is sourced from the Oakland Museum of California press office.
Alameda County
Ferry Fares to Increase July 1 as Ridership Hits Record Highs
The Oakland and Alameda routes will increase from $4.90 to $5.10, the South San Francisco route will go up from $7.40 to $7.60, and the Vallejo route will increase from $9.90 to $10.

By Mike Aldax, The Richmond Standard
Starting July 1, the standard adult fare for the San Francisco Bay Ferry route between Richmond and San Francisco will increase to $5.20, up from the current $4.90.
Discounted fares for eligible passengers, including youth, seniors, people with disabilities, and Clipper START users, will rise to $2.60 from the current $2.40. Children under 5 will continue to ride for free.
The Oakland and Alameda routes will increase from $4.90 to $5.10, the South San Francisco route will go up from $7.40 to $7.60, and the Vallejo route will increase from $9.90 to $10.
The adjustments are part of a systemwide fare update approved by the agency’s Board of Directors, which is moving away from a flat 3% annual increase to route-specific pricing for the 2027 and 2028 fiscal years.
This fare update arrives as San Francisco Bay Ferry celebrates a historic May, transporting 301,270 passengers. The record-breaking figure represents an 8% increase over May 2025 and marks the third consecutive month of record-setting ridership.
Furthermore, it is the sixth month in a row that passenger numbers have exceeded pre-pandemic levels. Weekend travel has been a primary driver of this growth, with average weekend ridership seeing a 56% increase compared to pre-pandemic trends.
The agency states that the fare adjustments are necessary to ensure the long-term fiscal sustainability of public ferry services. By shifting to route-specific adjustments, the agency aims to offset rising operating costs while maintaining the high levels of service frequency and reliability.

WORK FROM HOME
Home-based business with potential monthly income of $10K+ per month. A proven training system and website provided to maximize business effectiveness. Perfect job to earn side and primary income. Contact Lynne for more details: Lynne4npusa@gmail.com 800-334-0540
![]()


Oakland Museum Presents Landmark Retrospective Celebrating Beloved Bay Area Artist Mildred Howard

Ferry Fares to Increase July 1 as Ridership Hits Record Highs

Stop the Hate Symposium Brings Oakland Together Through Dialogue, Partnership, and Community Healing

Six Months in, Probate Reform Coalition Marks Progress in Protecting Elders From Financial Abuse

A Long Time Coming: School District Kicks Off Massive $97 Million Renovation of West Oakland’s McClymonds High School

IN MEMORIAM: Oakland Dance Legend Reginald Ray-Savage, 67

UC Berkeley Named Top Public University in the U.S. and No. 7 in the World by ‘U.S. News’

NCBW-OBAC Champions Black Women Entrepreneurs at Business en Blaque Expo

Lock In Car Price: Avoid Dealer Payment Traps!

Sell Your Car: Get Offers BEFORE Visiting Dealerships!

The Conversation With Al McFarlane 6/23/26

Media Monday 6/22/26

LIVE! ASK ALMA! — TUES. 6.23.26 7PM EST

Car Buying Secrets: 4 Hidden Checks Before You Sign!

Book Review: Books for College-Bound Students

Q&A with Steven Bradford: Why He Wants Your Vote for California Insurance Commissioner

Oakland Mayor Pushes Charter Overhaul to Clarify Roles in City Government, Increase Accountability and Improve Service Delivery

The Ladies of Delta Sigma Theta Hold Day of Advocacy at the Capitol in Sacramento

OPINION: The Fire of Oakland’s Justin Jones

How Is AI Affecting California? The State Wants You to Share Your Story

California Launches Free Diaper Program for Newborns Statewide

Rep. Kamlager-Dove Introduces Bill to Protect Women in Custody After Reports Detailing Miscarriages and Neglect

More and More, Black Californians Are Worried About Rising Costs of Housing, Energy, Food and Gas

After 10-Year Wait, Fillmore Heritage Center Reopens in San Francisco

Asm. Jackson Bill Requiring Anti-Hate Speech Training for Calif. Public Officials Sent to “Suspense File”

Oakland Post: Week of May 20 – 26, 2026

Oakland Post: Week of May 27 – June 2, 2026

Oakland Post: Week of June 3 – 9, 2026

Advocates Rally at State Capitol to Demand Heat Protections for Incarcerated People; More Funding for DV Survivors
The Conversation With Al McFarlane 6/23/26
Media Monday 6/22/26
LIVE! ASK ALMA! — TUES. 6.23.26 7PM EST
Car Buying Secrets: 4 Hidden Checks Before You Sign!

Is This 550 HP Charger Worth YOUR Money? AutoNetwork Review

Celebrating Juneteenth – Frederick Douglass on education and resistance

LIVE! — ASK ALMA! — TUES. 6.19.26 7PM EST

Hyundai Ioniq 5 Parking, Safety, and 360 View #shorts

2025 Ioniq 5 New Wiper & Powerful Performance! #shorts

Electric SUV Range: Is 259 Miles Enough? #shorts

EV Charging: How Fast Can You Charge an Electric Vehicle? #shorts

Biometric Cooling… Messaging Seats…Come on! 2025 Infiniti QX80 Autograph 4WD

Charged Up: Witness the Magic of a Fully Electric Car! #shorts

Range Rover Sport PHEV Included…: See What’s Inside This Luxury SUV! #shorts

Invisible Hood View: Perfect Parking with X-Ray Vision! #shorts
-
 Art3 weeks ago
After 10-Year Wait, Fillmore Heritage Center Reopens in San Francisco
-
 Activism3 weeks ago
Oakland Post: Week of June 3 – 9, 2026
-

 #NNPA BlackPress3 weeks ago
5 Cleveland Police Officers Injured, Gunfire Erupts During East Side Pursuit
-

 #NNPA BlackPress3 weeks ago
2026 World Cup is Here and Atlanta is Ready For It
-

 Arts and Culture3 weeks ago
COMMENTARY: Black Music is the Sound of Black Freedom: Let Us Reclaim Both This Juneteenth
-

 Art3 weeks ago
Oakland Director Boots Dazzles Once Again in ‘I Love Boosters’
-

 #NNPA BlackPress3 weeks ago
COMMENTARY: Using Art, Healing, And Community to Transform Mental Health Dialogue
-

 #NNPA BlackPress3 weeks ago
Venus Williams Calls a Sabalenka Exit a Tragedy